I have just completed the Picaxe Casio Calculator Data Logger II. This was inspired by a piece of work completed by Mike Fenton. See here - the major differences 1) handles all the data processing, 2) bi-directional communications for setup and config and 3) up to 1530 samples.
I have built upon this good work with the M series Picaxe chips and I have a completed data logger based on the Casio Graphic Calculator.
Essentially, the Picaxe is the sensor. The Picaxe handles the communication and timing between to and from the Casio Graphic Calculator. The Casio Graphic Calculator sends commands, in terms of setup data and requests for information, and the Casio Graphic Calculator handles the data and the graphics.
The data logger can store 255*6 pages of data. This information is overwritten when the pages are full. Samples can be taken between 2 seconds and 6 minutes. The Casio Graphic Calculator shows the results dynamically on the graphics screen.
You can use Casio Graphic Calculator to analyse the data or you can transfer to your PC. You can also regraph any page of data and you can reset a data log from where you left off.
I have posted a video on YouTube of the Casio Graphic Calculator Data Logger II. See the YouTube video here.
High level details of the code
If anyone is interested in the Casio I will share. Send me a message, I could not post as CODE in this posting.
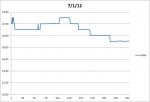
I am using the data logger to capture the temperature every time my Gas meter uses one unit of gas but this solution could be used for many different types of data logging. These calculators are very common schools and this would be a great learning aid.
Anyway, another project done. I needed a data logger - now I have one.
Anobium
I have built upon this good work with the M series Picaxe chips and I have a completed data logger based on the Casio Graphic Calculator.
Essentially, the Picaxe is the sensor. The Picaxe handles the communication and timing between to and from the Casio Graphic Calculator. The Casio Graphic Calculator sends commands, in terms of setup data and requests for information, and the Casio Graphic Calculator handles the data and the graphics.
The data logger can store 255*6 pages of data. This information is overwritten when the pages are full. Samples can be taken between 2 seconds and 6 minutes. The Casio Graphic Calculator shows the results dynamically on the graphics screen.
You can use Casio Graphic Calculator to analyse the data or you can transfer to your PC. You can also regraph any page of data and you can reset a data log from where you left off.
I have posted a video on YouTube of the Casio Graphic Calculator Data Logger II. See the YouTube video here.
High level details of the code
The Casio Graphic Calculator communicates with the Picaxe via TTL. This requires only a very simple circuit.
The Casio Graphic Calculator to PC link is a little trickier but not hard. These circuits are available on the web.
The Casio Graphic Calculator can send up to 28 variables (real numbers) to the Picaxe (not sure what you will be doing with real numbers.... integers sort of work with the Picaxe...)
The Picaxe can response with variable up to 65535 (or you could implement two complement and handle this in the Casio Graphic Calculator for negative numbers).
The Picaxe has a simple timer looop, this can overridden by an external switch event.
To send data from the Casio Graphic Calculator is
To receive data into the Casio Graphic Calculator is
The Casio Graphic Calculator to PC link is a little trickier but not hard. These circuits are available on the web.
The Casio Graphic Calculator can send up to 28 variables (real numbers) to the Picaxe (not sure what you will be doing with real numbers.... integers sort of work with the Picaxe...)
The Picaxe can response with variable up to 65535 (or you could implement two complement and handle this in the Casio Graphic Calculator for negative numbers).
The Picaxe has a simple timer looop, this can overridden by an external switch event.
To send data from the Casio Graphic Calculator is
Send (variable)
To receive data into the Casio Graphic Calculator is
Receive (variable)
The code in the Casio Graphic Calculator revolves around the getting data and handling display. Luckily, I had this calculator for my work many years ago and the programming language came back with some ease.
If anyone is interested in the Casio I will share. Send me a message, I could not post as CODE in this posting.
I am using the data logger to capture the temperature every time my Gas meter uses one unit of gas but this solution could be used for many different types of data logging. These calculators are very common schools and this would be a great learning aid.
Anyway, another project done. I needed a data logger - now I have one.
Anobium
Last edited: