Iam trying to draw rpm realtime graph in c#, but I have strange line drop sometimes. I just noticed it happens when I spin it high and i little bit drop rpm, then it shows like huge drop
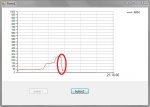

Can someone c# guru check if this programm error or picaxe ?
C# 2010 project View attachment RPM.zip
Can someone c# guru check if this programm error or picaxe ?
Code:
main:
count B.3,1000, w1
sertxd(#w1)
goto main
Code:
namespace RPM
{
    public partial class Form1 : Form
    {
        private const int CHART_SECONDS = 60;
        private Series mySerie;

        public delegate void AddDataDelegate();
        public AddDataDelegate addDataDel;

        public Form1()
        {
            InitializeComponent();

            addDataDel += new AddDataDelegate(AddData);

            DateTime minValue = DateTime.Now;
            DateTime maxValue = minValue.AddSeconds(CHART_SECONDS);
            chart1.ChartAreas[0].AxisX.Minimum = minValue.ToOADate();
            chart1.ChartAreas[0].AxisX.Maximum = maxValue.ToOADate();
            chart1.ChartAreas[0].AxisX.LabelStyle.Format = "T";
            chart1.ChartAreas[0].AxisX.IntervalType = DateTimeIntervalType.Minutes;
            chart1.ChartAreas[0].AxisX.Interval = 1;
            chart1.ChartAreas[0].AxisX.MajorGrid.LineColor = Color.DarkGray;
            chart1.ChartAreas[0].AxisX.MinorGrid.IntervalType = DateTimeIntervalType.Seconds;
            chart1.ChartAreas[0].AxisX.MinorGrid.Interval = 10;
            chart1.ChartAreas[0].AxisX.MinorGrid.LineColor = Color.LightGray;
            chart1.ChartAreas[0].AxisX.MinorGrid.Enabled = true;

            chart1.ChartAreas[0].AxisY.Minimum = 0;
            chart1.ChartAreas[0].AxisY.Maximum = 1000;
            chart1.ChartAreas[0].AxisY.IntervalType = DateTimeIntervalType.Number;
            chart1.ChartAreas[0].AxisY.Interval = 50;
            chart1.ChartAreas[0].AxisY.MajorGrid.LineColor = Color.DarkGray;
            chart1.ChartAreas[0].AxisY.MinorGrid.IntervalType = DateTimeIntervalType.Number;
            chart1.ChartAreas[0].AxisY.MinorGrid.Interval = 50;
            chart1.ChartAreas[0].AxisY.MinorGrid.LineColor = Color.LightGray;
            chart1.ChartAreas[0].AxisY.MinorGrid.Enabled = true;

            chart1.Series.Clear();
            mySerie = new Series("RPM");
            mySerie.ChartType = SeriesChartType.FastLine;
            mySerie.BorderWidth = 1;
            mySerie.Color = Color.Red;
            mySerie.XValueType = ChartValueType.DateTime;
            chart1.Series.Add(mySerie);

            DateTime timeStamp = DateTime.Now;
            chart1.Series[0].Points.AddXY(timeStamp, 0);
        }

        private void serialPort1_DataReceived(object sender, SerialDataReceivedEventArgs e)
        {
        chart1.Invoke(addDataDel);
        }


        public void AddData()
        {
            DateTime timeStamp = DateTime.Now;
            string stringValue = serialPort1.ReadExisting();
            chart1.Series[0].Points.AddXY(timeStamp, (int.Parse(stringValue)*20)/2);

            double removeBefore = timeStamp.AddSeconds(-CHART_SECONDS).ToOADate();
            while (mySerie.Points[0].XValue < removeBefore)
            {
                mySerie.Points.RemoveAt(0);
            }
            chart1.ChartAreas[0].AxisX.Minimum = mySerie.Points[0].XValue;
            chart1.ChartAreas[0].AxisX.Maximum = DateTime.FromOADate(mySerie.Points[0].XValue).AddSeconds(CHART_SECONDS).ToOADate();
            chart1.Invalidate();


        }

        private void button1_Click(object sender, EventArgs e)
        {
          serialPort1.PortName = "COM7";
          serialPort1.BaudRate = 4800;
          serialPort1.Open();
          if (serialPort1.IsOpen)
          {
              buttonStart.Enabled = false;
              buttonStop.Enabled = true;

          }
        }

        private void buttonStop_Click(object sender, EventArgs e)
        {
        if (serialPort1.IsOpen)
           {
               serialPort1.Close();
               buttonStart.Enabled = true;
               buttonStop.Enabled = false;

           }
        }

        private void Form1_FormClosing(object sender, FormClosingEventArgs e)
        {
            if (serialPort1.IsOpen) serialPort1.Close();
        }

    }
}
Last edited: