I was inspired by an article in the January 2012 issue of Elektor which described how it was possible to measure the load on the Electricity National Grid by reading the Frequency of the Mains supply. The greater the load on the Grid, the slower the generators run and so the frequency slows down. The lighter the load, the faster the generators run and so the frequency increases. The Grid is constantly compensating for the fluctuations in load and attempt to balance the load with the supply by bringing more or less generation capacity on line. The frequency of the Grid should not normally drift by more or less than 0.4% or 0.2Hz.
The meter I have designed measures the frequency and voltage of the supply using a single 14M2 processor by sampling the output of a LOW VOLTAGE (9V AC) transformer and displays it on an LCD, it automatically detects frequencies of 50Hz or 60Hz, has options for displaying the voltage as 240V (UK) 220V (EU) or 120V (US) and will capture events where the nominal supply level has fallen above or below 10% of that nominal level. A facility is provided for battery backed power to maintain operation in short power cuts so that these 'events' are maintained in memory. To compensate for the variations of the oscillators within different PicAxe processors, it is possible to add /subtract compensation by placing a link at power up, this compensation value is stored in Eeprom so needs performing once only. The Voltage and frequency are displayed numerically on the top line of a standard 16x2 LCD display, with the bottom line of the display showing a bargraph representation of the frequency, centred at 50Hz (or 60Hz) with more bars being displayed left of centre as the frequency falls away from the nominal frequency and more bars to the right as frequency increases above the nominal frequency. The resolution of each bargraph element is just 0.025Hz, or 25 milli Hertz (at 50Hz). The frequency is sampled three times for the positive portion of the AC signal, and again for the negative portion of the AC signal with an average being taken of these samples to reduce the possibility of them being corrupted.
The Basic code very nearly fills the 14M2, much of it being taken up with the calculations required to convert the PulsIn values used for the frequency measurement into an accurate value of the frequency. The PDF document goes into the detail of how these calculations were settled on, and the accuracy they offer while staying within the limitations of the integer maths of the PicAxe.
Basic code:
View attachment GridFreq_Monitor_16x2_3_01_1.bas
Circuit diagram:
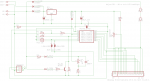
Last edited:
")