Hi,
This thread is not a plea for help as such, but I will be interested to hear if anybody can confirm (or dispute) my observations. It's not likely to be relevant to typical PICaxe applications, but members who frequent the "Finished Projects / Code Snippetts" section of the forum may be aware that I have been attempting to devise some "Higher Resolution" methods for the PICaxe to measure its own supply rail. This data can be useful in its own right, but is essential to get any "worthwhile" results from my new "ReadInternalTemperature" code. The methods have been generally very successful, with the exception that several times I have been "stung" by unexpected behaviour when attempting to use the FVR1024 Fixed Voltage Reference.
There are two basic reasons why one might want to use FVR1024: 1. To obtain a higher resolution from the on-chip DAC or ADC (e.g. 1 mV resolution steps) or 2. to work with a supply rail near to or below 2 volts. So far, I have not found any issues when using FVR1024 with the ADC or DAC at a supply voltage above 3 volts, and that includes using it as the ADC reference (which is advised against by PIC and PICaxe data sheets). The problems are mainly concerned with using FVR1024 as the reference for the DAC at lower supply voltages. All my observations have been with M2s; the commands for X2s are different or unavailable (and unsuccessful operation was reported in the forum thread below).
It's worth mentioning here that FVR1024 is the chip's "raw" reference voltage and FVR2048 and FVR4096 are outputs from associated rail-to-rail Op-Amps with nominal gains of 2 and 4. Thus the higher references have a slightly worse tolerance (accuracy) than FVR1024 (which might be another reason for using it), but they do remain stable right down to within ~100 mV "headroom" to the Vdd supply. However, the 14/20M2s are specified to work down to 1.8 volts (and typically 1.5 volts with the Brownout Detector disabled), so FVR1024 is the only available reference if one wishes to develop a "full voltage range" application.
The first "issue" I observed was with my "CALIBADC13" code snippet, which used FVR1024 with the aim of working down to the minimum possible supply voltage. However, I discovered that it lost all useful accuracy below about 2.8 volts, because the DAC output started to "sag" significantly. Therefore FVR1024 offered no benefit (in fact a major flaw) compared with using FVR2048. See the pale blue line in the second graph (and associated text) in post #24 of this forum thread.
More recently, I have been trying to devise a "better" READINTERNALTEMP algorithm, for which a highly accurate supply voltage measurement is required. My "CALIBADC15" routine has proved very staisfactory but works only down to 2.1 volts because it uses FV2048. So I devised an alternative method (still to be documented) which uses FVR1024 as the ADC reference voltage. Again, this appeared to work well at higher voltages but went "wild" below 2.1 volts. However, this is actually an interesting observation because it shows that the internal "temperature-sensing" hardware can be an excellent indicator of power rail stability over the short-term (i.e. whilst the temperature does not change).
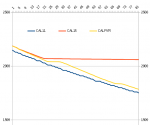
Here are two graphs that I've plotted using the method and hardware described in this finished project. The "zoomed" graph around 2000 mV, compares three methods of the PICaxe measuring its own supply against a horizontal axis of time. The "CAL 11" line (Blue) uses a slightly improved version of CALIBADC10 + PICaxe division to give "10 mV resolution" "steps" which are clear in the graph. The "CAL 15" line (Red) uses my CALIBADC15 code which can give excellent (~1 mV) resolution, but only down to 2.1 volts where the FVR2048 drops out. The third line (Yellow) measures the (exponentially falling) supply rail using the ADC referenced by FVR1024. The "error" is quite small (up to about 30 mV) but has a rather disasterous effect on the temperature calculation (Yellow) shown in the second graph.
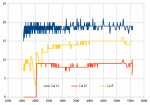
The second graph shows the same supply voltage measurements applied to my improved READINTERNALTEMP routine, which shows that temperature measurements (vertical axis) with around 1 degree C resolution are practical. In fact above about 3 volts it seems possible to achieve around 0.2 degree C resolution, but numerous problems, such as outlined here, arise at lower supply voltages. As previously observed, the Yelllow line (using FVR1024) starts to droop from about 2.8 volts and exhibits strange "ripples" below 2 volts.
To give an indication of the "sensitivity" of these measurements, the temperature line calculated from CALBADC15 has only been limited to zero (i.e. negative values set as 0), so the "cliff edge" fall really is the point at which FVR2048 stops regulating (and follows Vdd). This graph is an X-Y plot (Vdd across the X axis) so the apparently higher level of "noise" at the lower voltages is actually due to the greater number of points plotted (because the voltage is falling more slowly).
Cheers, Alan.
This thread is not a plea for help as such, but I will be interested to hear if anybody can confirm (or dispute) my observations. It's not likely to be relevant to typical PICaxe applications, but members who frequent the "Finished Projects / Code Snippetts" section of the forum may be aware that I have been attempting to devise some "Higher Resolution" methods for the PICaxe to measure its own supply rail. This data can be useful in its own right, but is essential to get any "worthwhile" results from my new "ReadInternalTemperature" code. The methods have been generally very successful, with the exception that several times I have been "stung" by unexpected behaviour when attempting to use the FVR1024 Fixed Voltage Reference.
There are two basic reasons why one might want to use FVR1024: 1. To obtain a higher resolution from the on-chip DAC or ADC (e.g. 1 mV resolution steps) or 2. to work with a supply rail near to or below 2 volts. So far, I have not found any issues when using FVR1024 with the ADC or DAC at a supply voltage above 3 volts, and that includes using it as the ADC reference (which is advised against by PIC and PICaxe data sheets). The problems are mainly concerned with using FVR1024 as the reference for the DAC at lower supply voltages. All my observations have been with M2s; the commands for X2s are different or unavailable (and unsuccessful operation was reported in the forum thread below).
It's worth mentioning here that FVR1024 is the chip's "raw" reference voltage and FVR2048 and FVR4096 are outputs from associated rail-to-rail Op-Amps with nominal gains of 2 and 4. Thus the higher references have a slightly worse tolerance (accuracy) than FVR1024 (which might be another reason for using it), but they do remain stable right down to within ~100 mV "headroom" to the Vdd supply. However, the 14/20M2s are specified to work down to 1.8 volts (and typically 1.5 volts with the Brownout Detector disabled), so FVR1024 is the only available reference if one wishes to develop a "full voltage range" application.
The first "issue" I observed was with my "CALIBADC13" code snippet, which used FVR1024 with the aim of working down to the minimum possible supply voltage. However, I discovered that it lost all useful accuracy below about 2.8 volts, because the DAC output started to "sag" significantly. Therefore FVR1024 offered no benefit (in fact a major flaw) compared with using FVR2048. See the pale blue line in the second graph (and associated text) in post #24 of this forum thread.
More recently, I have been trying to devise a "better" READINTERNALTEMP algorithm, for which a highly accurate supply voltage measurement is required. My "CALIBADC15" routine has proved very staisfactory but works only down to 2.1 volts because it uses FV2048. So I devised an alternative method (still to be documented) which uses FVR1024 as the ADC reference voltage. Again, this appeared to work well at higher voltages but went "wild" below 2.1 volts. However, this is actually an interesting observation because it shows that the internal "temperature-sensing" hardware can be an excellent indicator of power rail stability over the short-term (i.e. whilst the temperature does not change).
Here are two graphs that I've plotted using the method and hardware described in this finished project. The "zoomed" graph around 2000 mV, compares three methods of the PICaxe measuring its own supply against a horizontal axis of time. The "CAL 11" line (Blue) uses a slightly improved version of CALIBADC10 + PICaxe division to give "10 mV resolution" "steps" which are clear in the graph. The "CAL 15" line (Red) uses my CALIBADC15 code which can give excellent (~1 mV) resolution, but only down to 2.1 volts where the FVR2048 drops out. The third line (Yellow) measures the (exponentially falling) supply rail using the ADC referenced by FVR1024. The "error" is quite small (up to about 30 mV) but has a rather disasterous effect on the temperature calculation (Yellow) shown in the second graph.
The second graph shows the same supply voltage measurements applied to my improved READINTERNALTEMP routine, which shows that temperature measurements (vertical axis) with around 1 degree C resolution are practical. In fact above about 3 volts it seems possible to achieve around 0.2 degree C resolution, but numerous problems, such as outlined here, arise at lower supply voltages. As previously observed, the Yelllow line (using FVR1024) starts to droop from about 2.8 volts and exhibits strange "ripples" below 2 volts.
To give an indication of the "sensitivity" of these measurements, the temperature line calculated from CALBADC15 has only been limited to zero (i.e. negative values set as 0), so the "cliff edge" fall really is the point at which FVR2048 stops regulating (and follows Vdd). This graph is an X-Y plot (Vdd across the X axis) so the apparently higher level of "noise" at the lower voltages is actually due to the greater number of points plotted (because the voltage is falling more slowly).
Cheers, Alan.
